Map Timeline
The map timeline feature lets you travel back in time to see how your project area has changed. Using historical satellite imagery, you can observe land cover changes, vegetation growth, deforestation, restoration progress, and more — directly on your project map.
Last updated 5 months ago
The timeline is available to all users, including free and paid plans.
How to activate the timeline
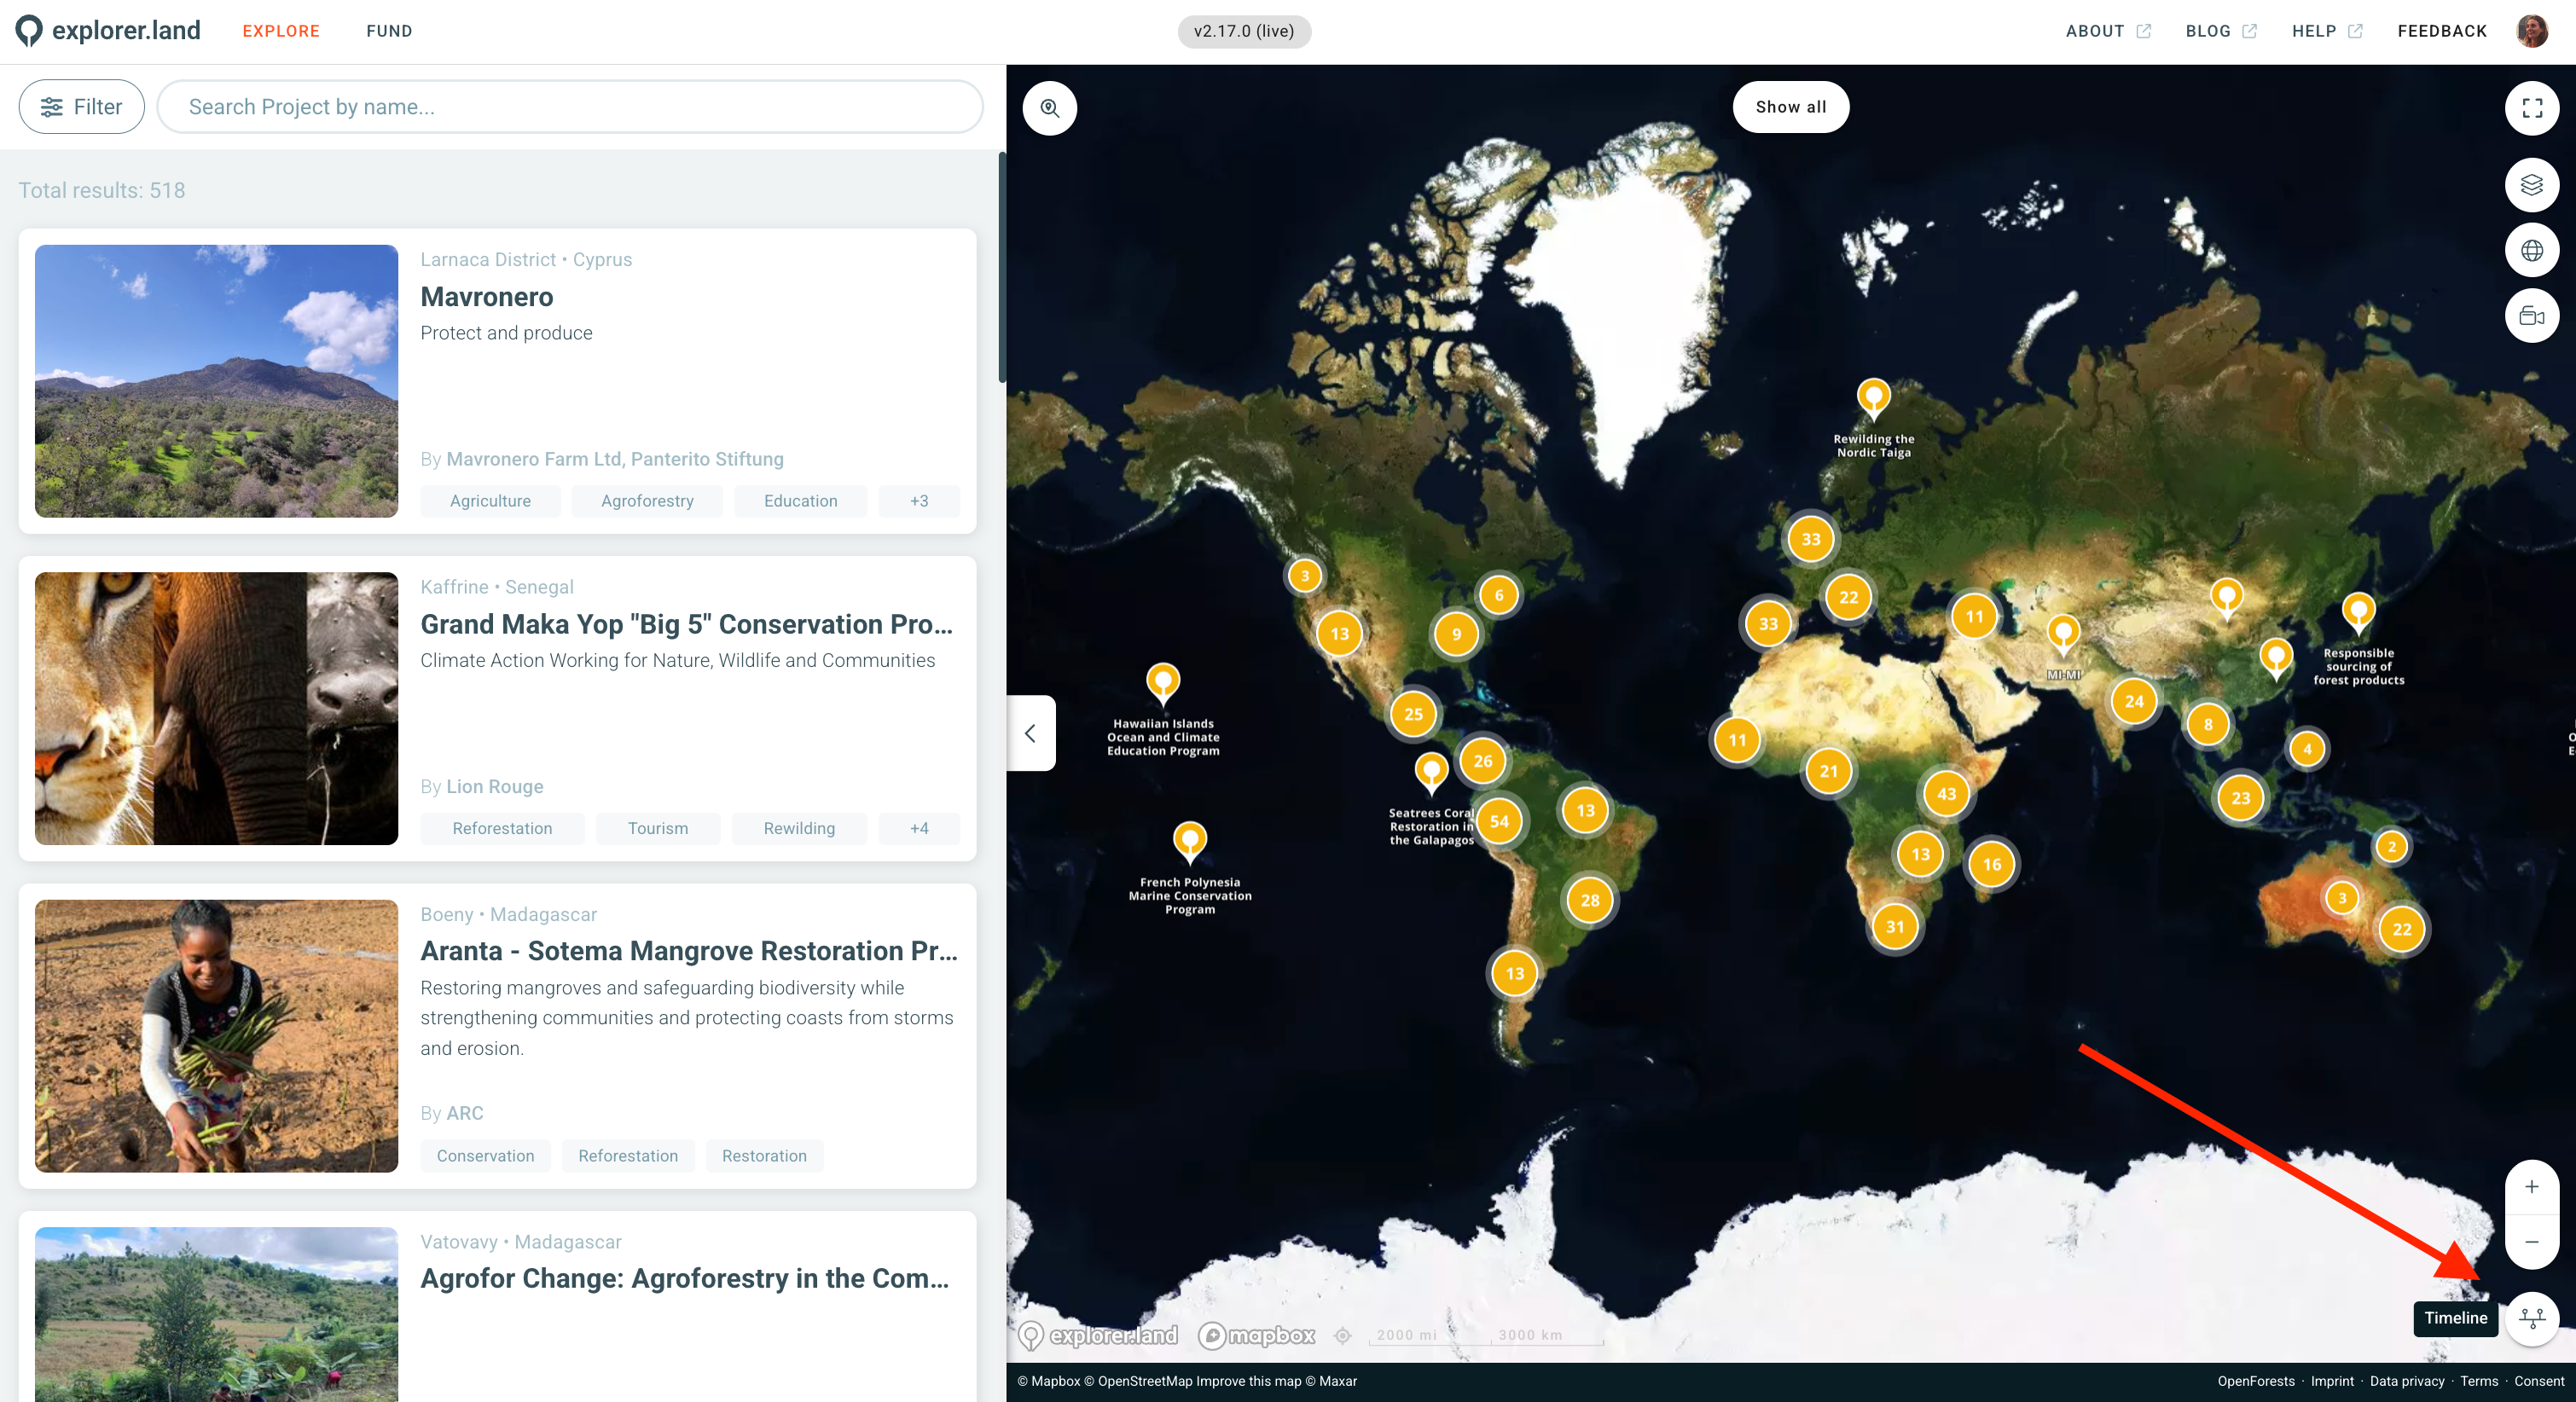
The timeline control is located at the bottom of the map. Click on it to expand it and start exploring historical imagery.
Once active, you'll see:
A horizontal timeline bar along the bottom of the screen, with dots representing available imagery dates. Click any dot or drag along the bar to jump to that point in time.
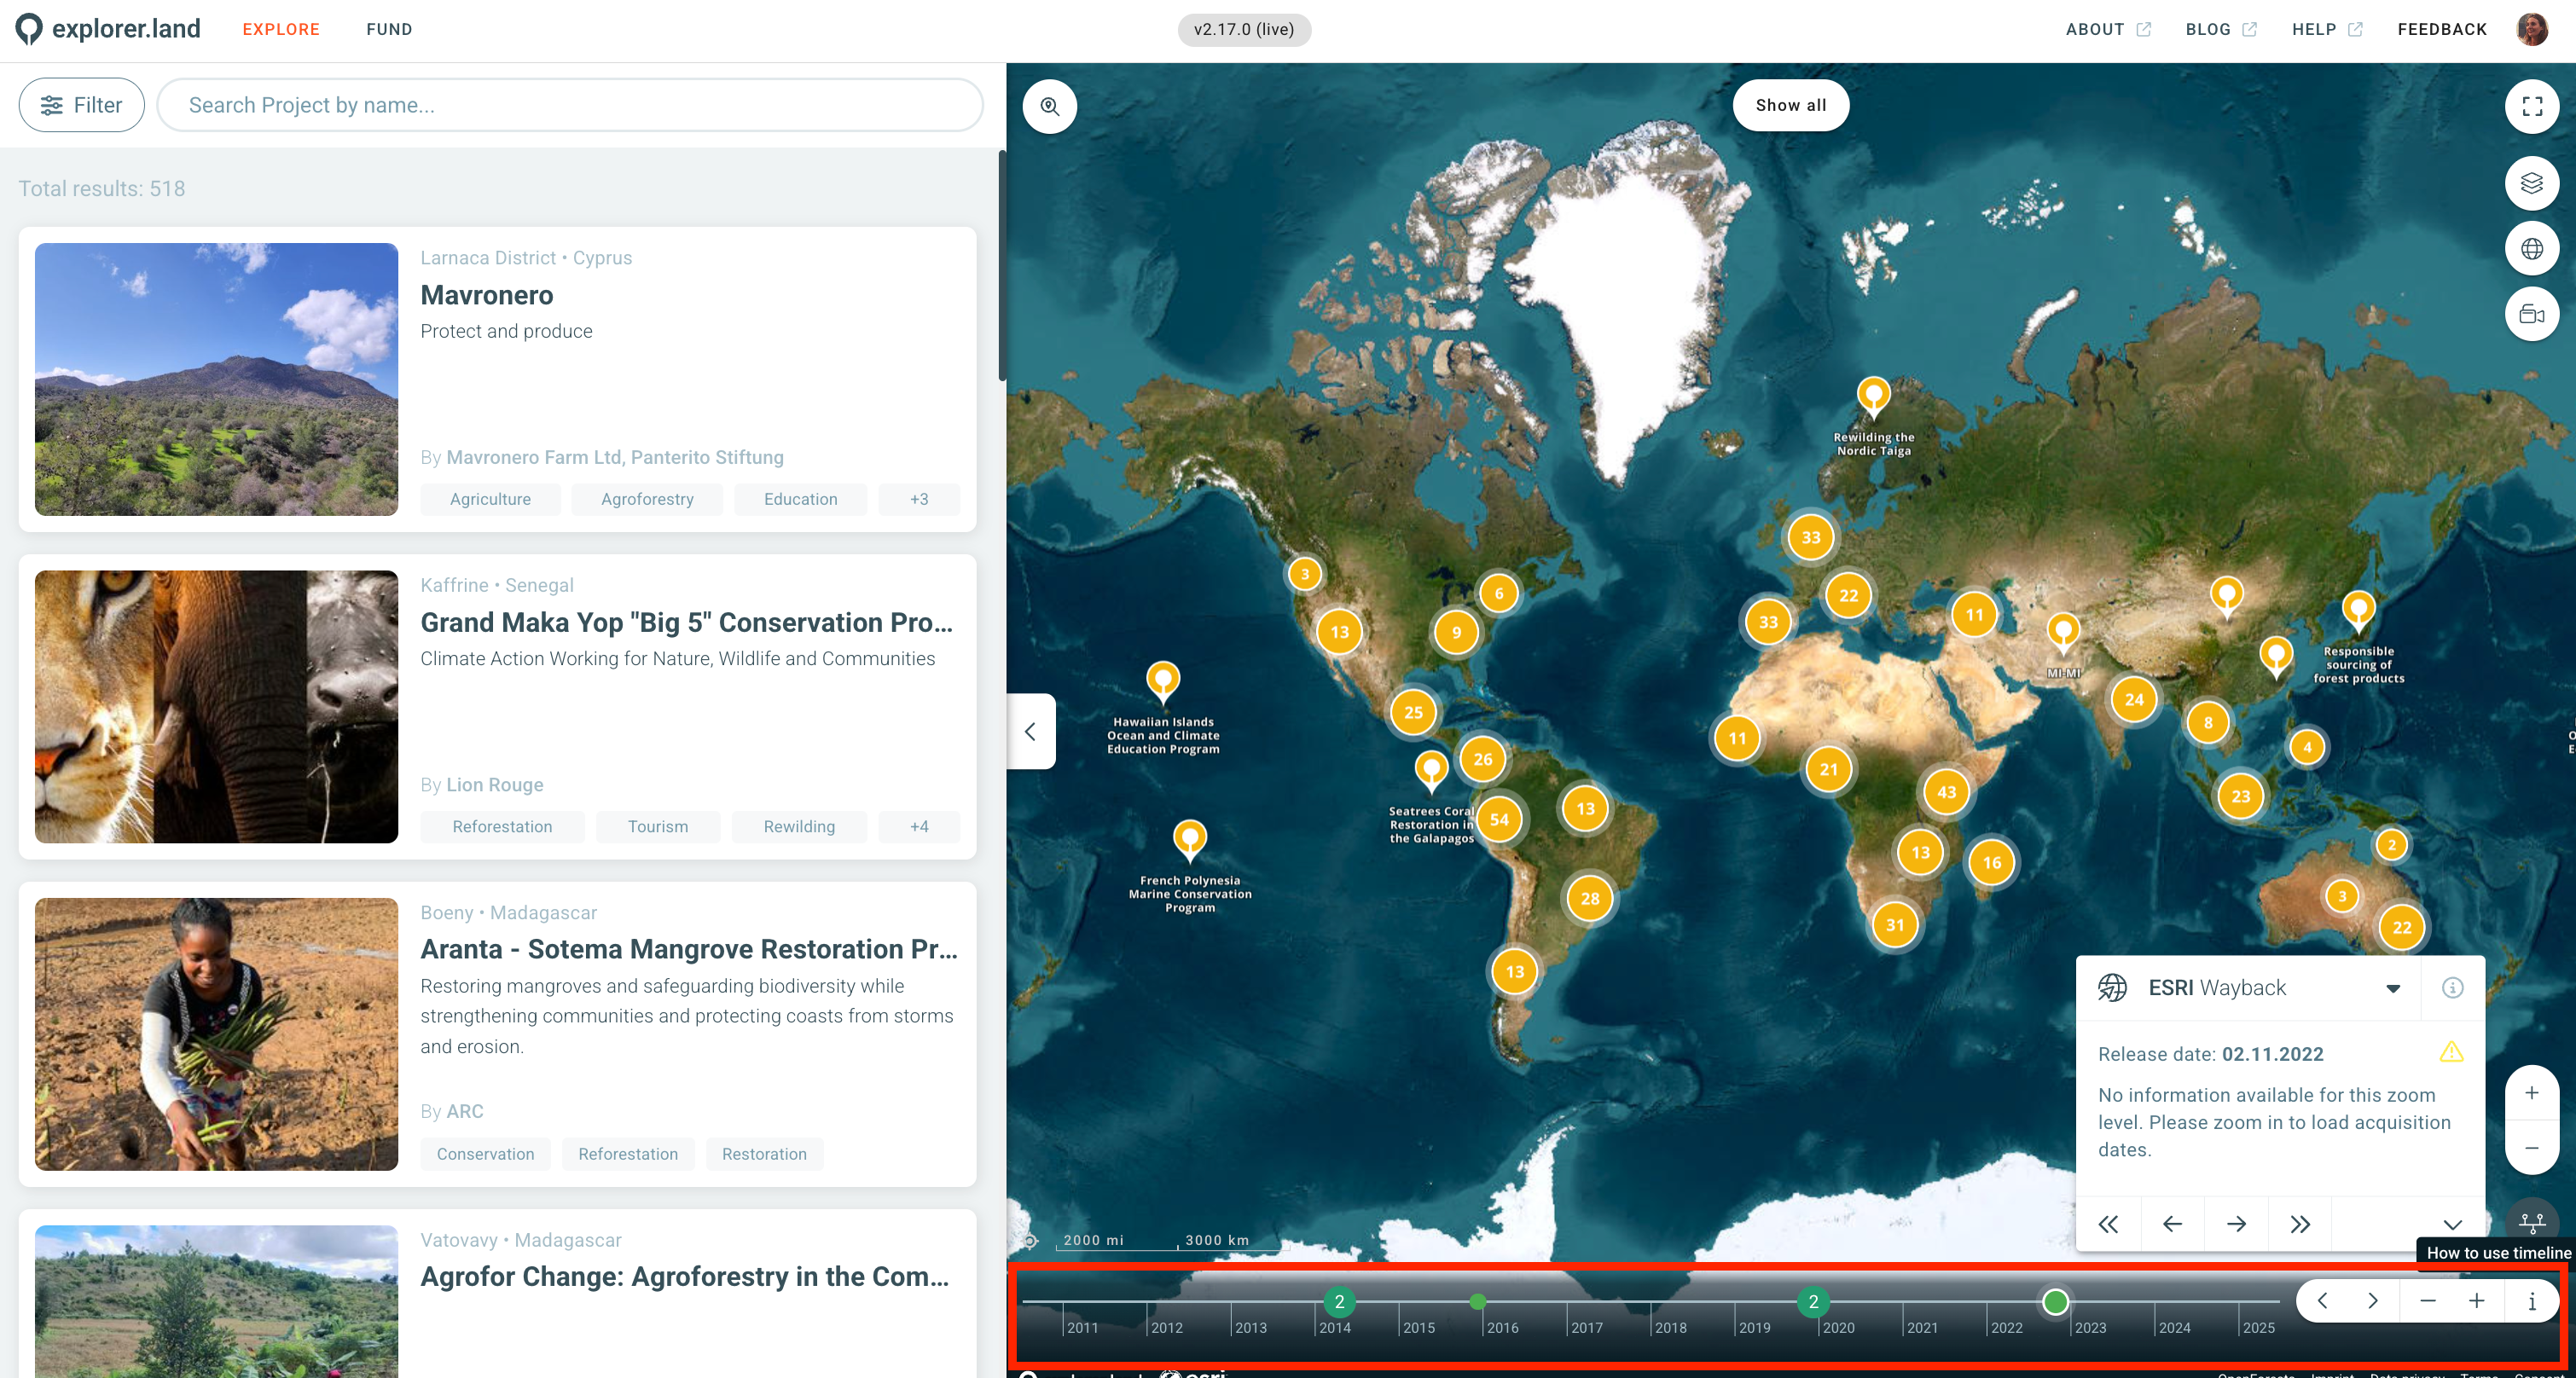
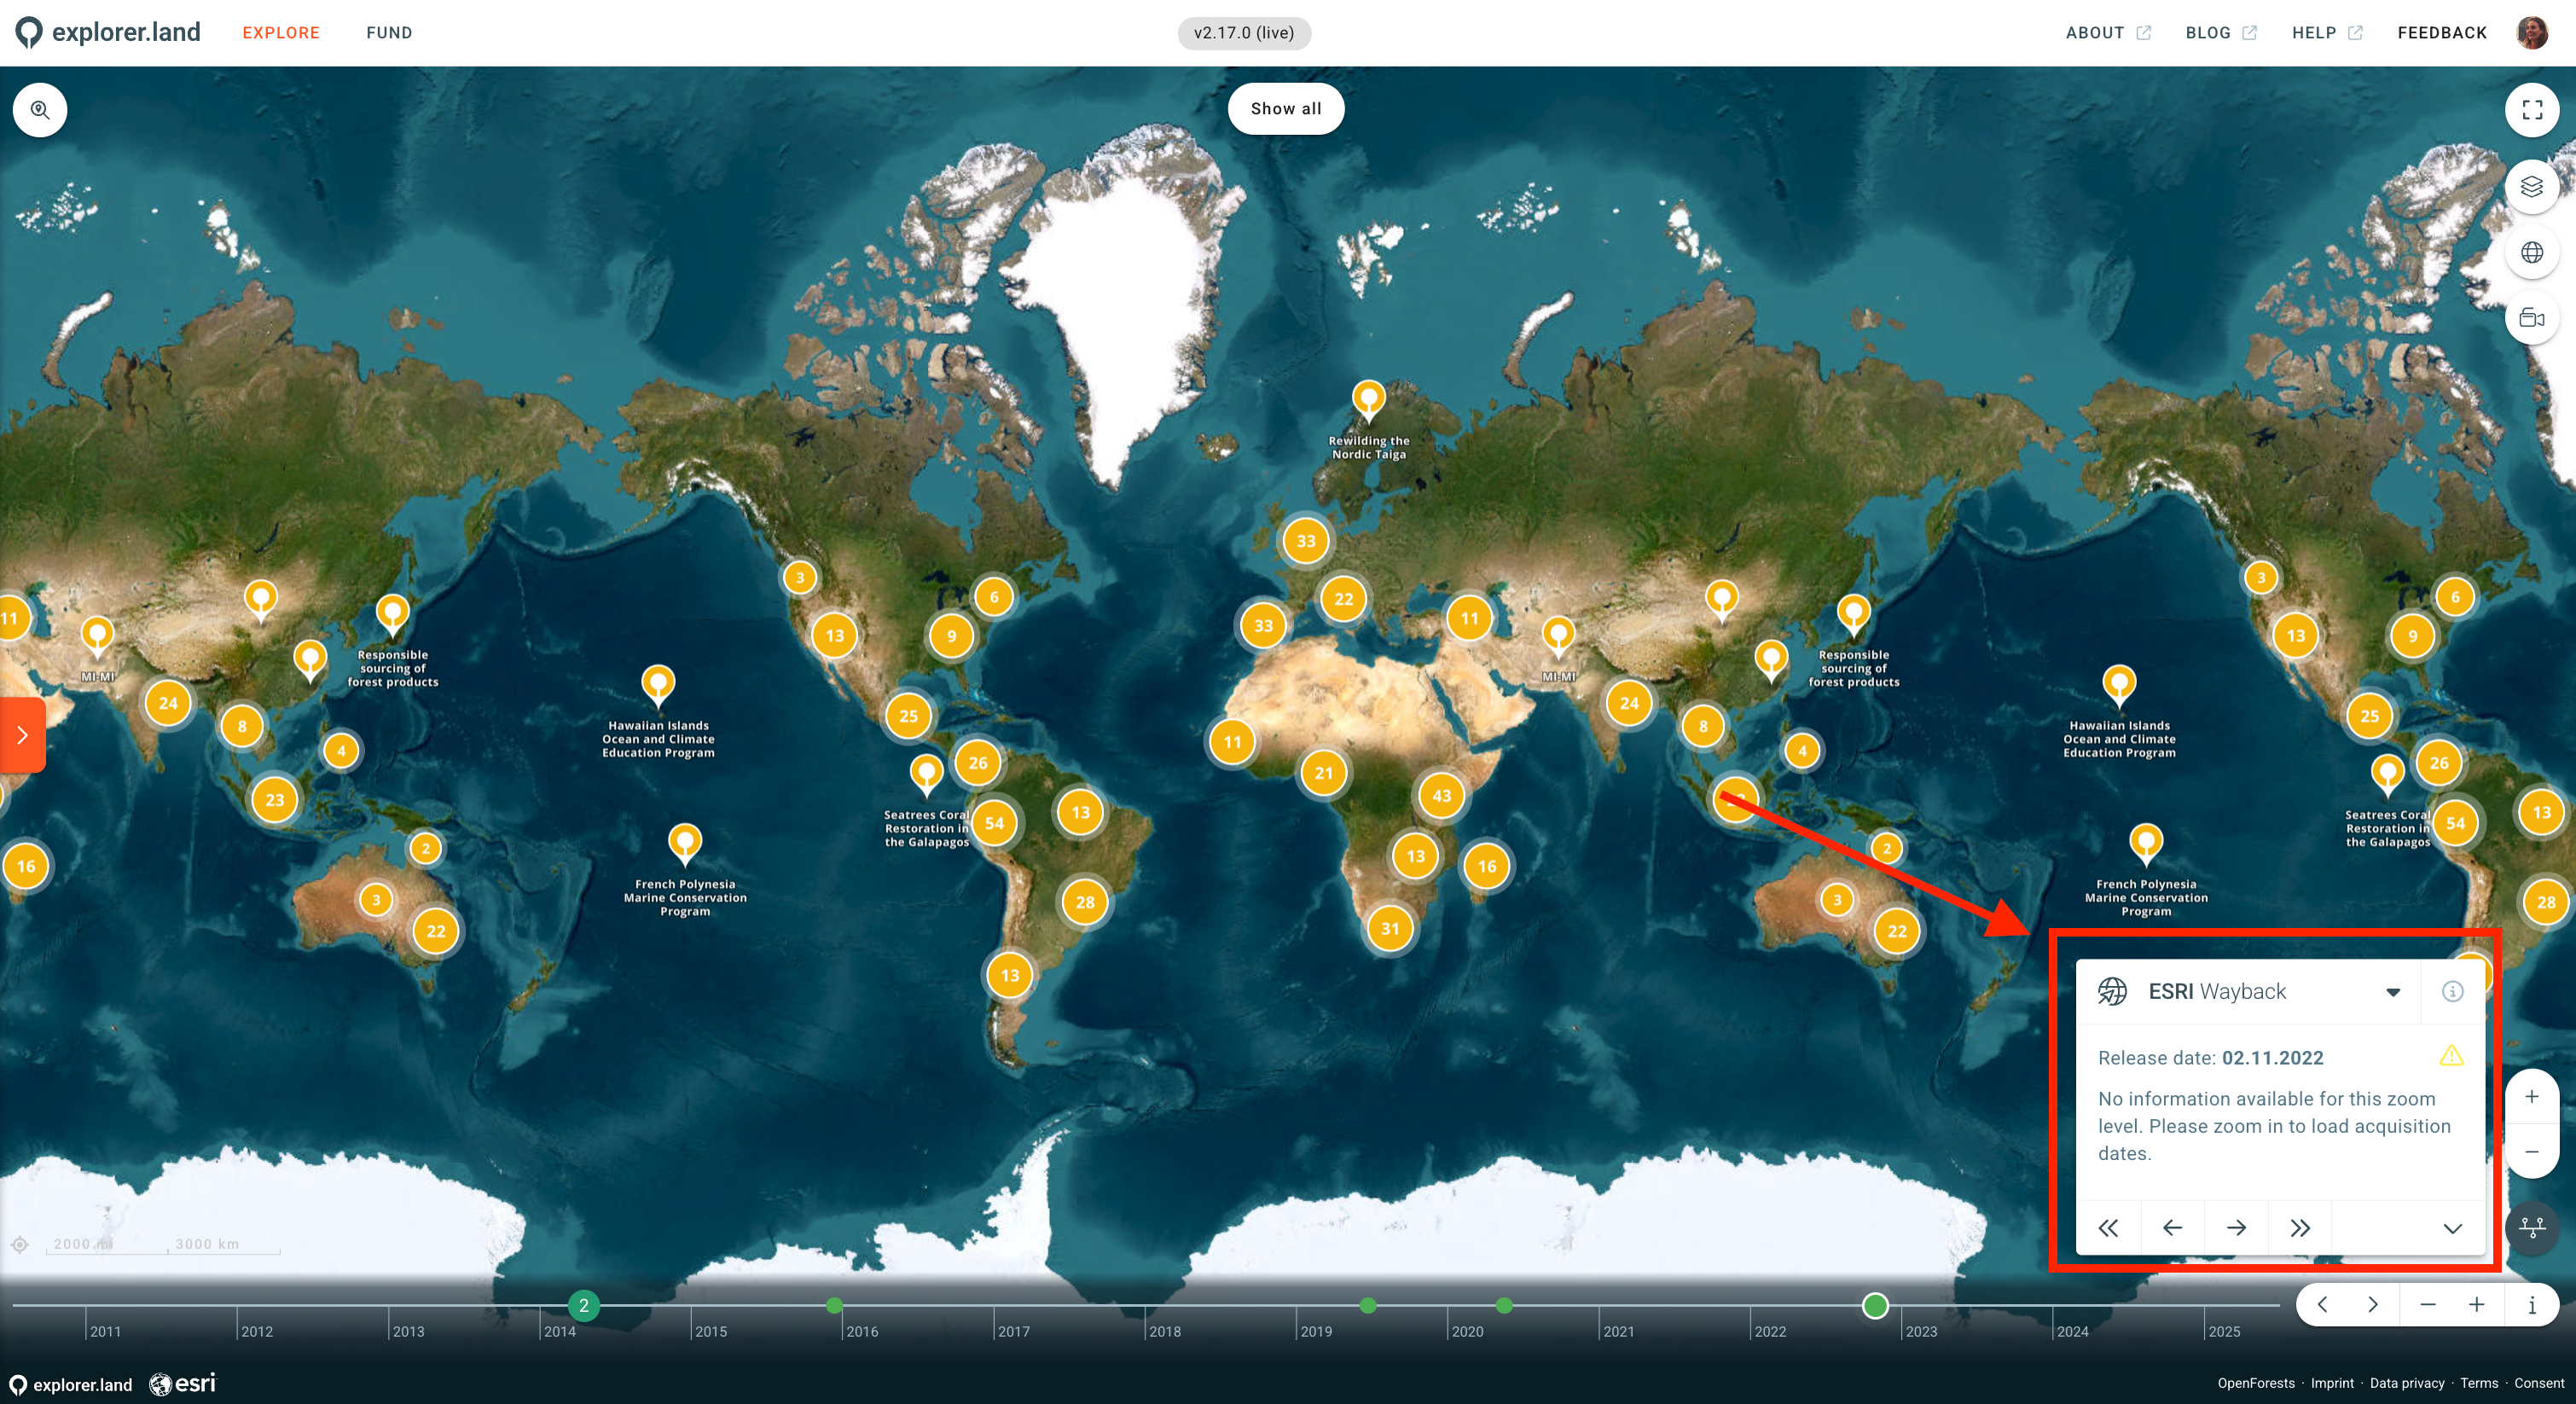
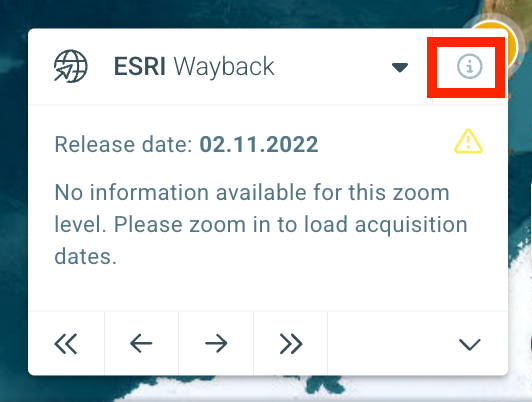
A source panel in the bottom right, showing which imagery source is active (NICFI PlanetLabs or ESRI Wayback), the acquisition date of the currently displayed imagery, and navigation arrows to step forward or backward through dates one by one.
Imagery sources
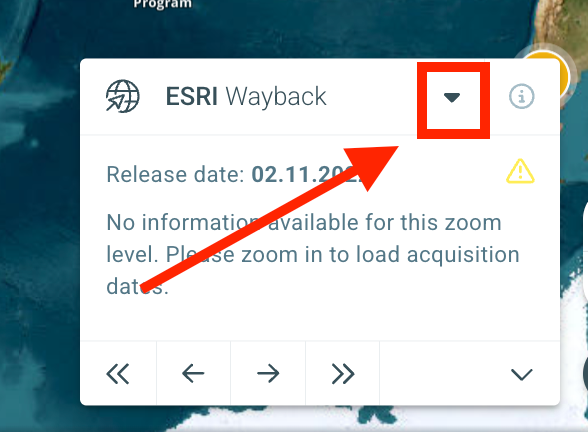
explorer.land offers two timeline sources. You can switch between them using the dropdown in the source panel, depending on your project's location and needs.
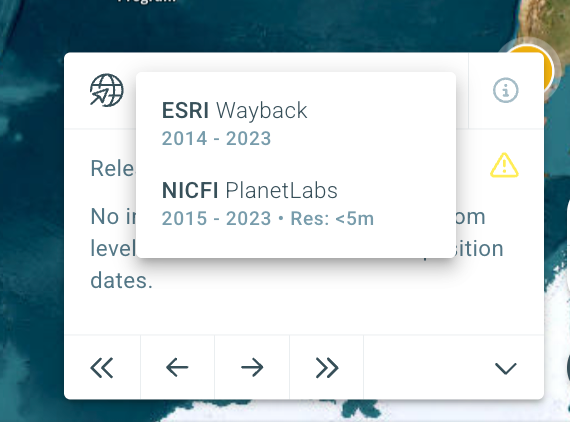
The default timeline when activated is ESRI Wayback.
ESRI Wayback
ESRI Wayback is a digital archive of the World Imagery baselayer, providing monthly snapshots of global satellite and aerial imagery going back to 2014.
Coverage: Global
Time range: February 2014 – today
Update frequency: Approximately monthly overall. At a local level, updates occur every 3 to 5 years, with higher frequency in urban areas.
Resolution: 15 m to 0.03 m per pixel, depending on the region. Many parts of the world have one meter or better resolution. Select metropolitan areas reach up to 0.3 m (Maxar imagery), while the rest of the world is generally covered at 0.6–1.2 m resolution.
How it works: Each version of the World Imagery baselayer is a mosaic of satellite and aerial images with different acquisition dates. Because imagery updates happen at irregular intervals across different regions, the images within a single snapshot may have been captured at different times — all prior to the publication date of that version.
Credits: Esri, Maxar, Earthstar Geographics, and the GIS User Community
All the information is available directly on the platform by clicking on the information icon
NICFI – Planet Labs
The NICFI timeline is powered by Planet Labs and provides high-frequency, high-resolution imagery focused on tropical forest regions. It is part of Norway's International Climate and Forests Initiative (NICFI) Satellite Data Program, which makes this imagery freely available to support forest monitoring and conservation efforts.
Coverage: Tropical forest regions between 30° North and 30° South. Some non- or low-forest-covered areas are excluded, as well as certain countries (including Australia, China, and the USA). For a full list of included countries, refer to the NICFI program documentation.
Time range: December 2015 – today
Update frequency: Bi-annual from December 2015 to August 2020, then monthly from September 2020 onwards.
Resolution: Less than 5 m per pixel
Credits: Norway's International Climate and Forests Initiative Satellite Data Program. Imagery by Planet Labs Inc.
Which source should I use?
Use ESRI Wayback if your project is located outside the tropics, or if you want global coverage with the option to zoom into very high resolution imagery in urban or well-mapped areas.
Use NICFI – Planet Labs if your project is in a tropical forest region and you need frequent, consistent updates — especially useful for monitoring deforestation, reforestation, or seasonal vegetation changes.
Questions?
If you have any questions or run into issues with the map timeline, contact us at support@openforests.com.